Data Scientist Salary Predictor
Metis Module 2 - Linear Regression & Web Scraping
ABSTRACT
I used Selenium automated web browsing software to scrape job posting data off Glassdoor.com to determine the features that most impact data scientist salaries in the United States. I cleaned and then modeled the data using a Random Forest Regressor to get an R2 of .94 and RMSE of 16.7k. After I performed permutation feature importance on the Random Forest model, the feature with the highest impact on Data Science salary came from if an employer provided the salary to Glassdoor.com. Other key features were if a job posting had ‘Senior’ or ‘Data Analyst’ in the title, as well as the age of the company.
BACKGROUND
The goal of Module Two was to create a well proposed linear regression model along with web-scraping to collect data that provided a continuous target variable for prediction. I aspired to explore a problem that not only met the needs of the module but also provided insight into a subject of interest to my classmates. To achieve this objective, I decided to use salary as a target with respect to the field of Data Science (“DS”). My exact question became: what features of a job listing can best predict the salary of a paid work position within the field of DS in the United States?
MATERIALS AND METHODS
DATA
I scraped all data using the Selenium suite of tools for automated web browsing
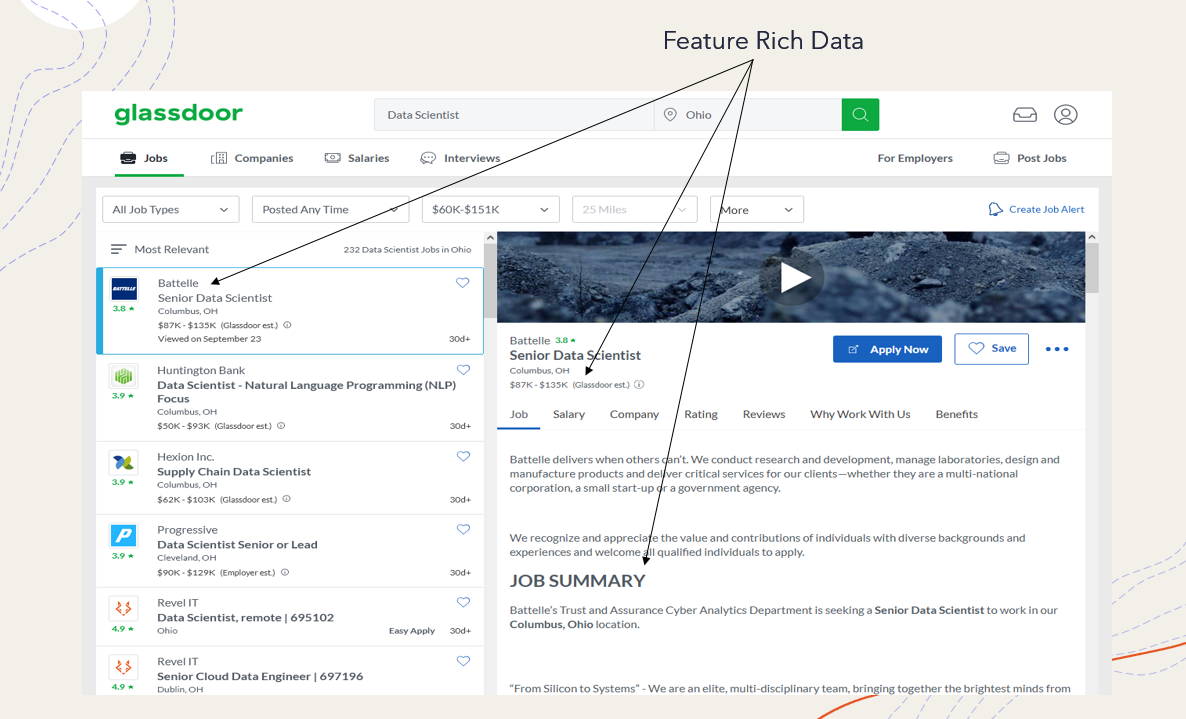
To collect the data, I used Glassdoor.com, which provides either an ‘Employer Provided Salary’ if available or a salary estimate to collect as the target variable for each job posting. Glassdoor has information regarding job locations, company names, and information such as company size, sector, and revenue.
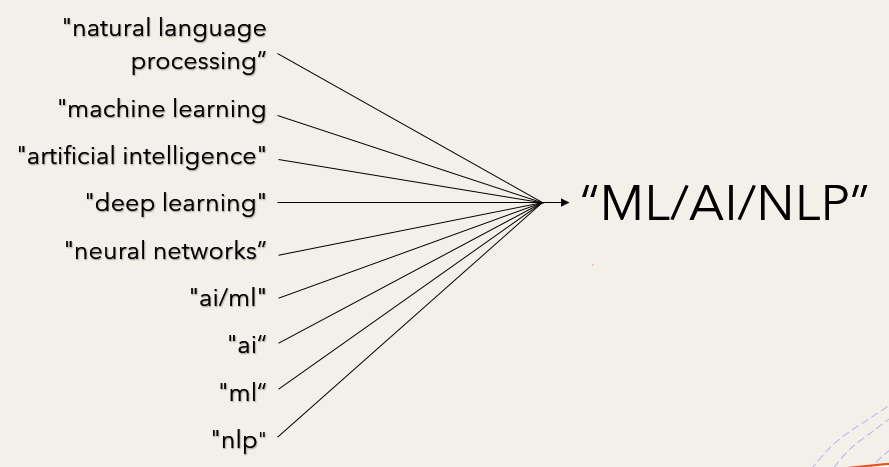
As far as employee qualifications and benefits, Glassdoor does not explicitly list such items. However, each job contains an employer provided description which I used in tandem with a predefined phrase/word list to identify potential keywords and phrases to increase my feature space. For example, I extracted phrases like ‘machine learning’ and ‘computer science’ and used regex to parse text and isolate terms such as ‘R,’ ‘AWS,’ and ‘AI.’
Glassdoor proved challenging in that jobs often repeated on every page of a search and the website frequently timed out. To maintain job diversity, I performed fifty-one searches for ‘Data Scientist’—one for every state, including Washington DC. To maintain scrape placement on each web page, I implemented a counter which preserved the exact job it was to scrape in case the site decided to time out. The counter allowed for coherent progression throughout the scrape, sustaining my sanity and will to continue.
DATA CLEANING
I cleaned all data using Pandas data analysis software library
Because Glassdoor advertised certain jobs nationwide, I created a data frame excluding the location column and dropped all duplicates—this action alone took the data frame from 12.2k entries to 3.7k. Additionally, I removed all features that did not have a salary estimate, which further reduced my entries to 3.4k: an overall whopping but necessary 72% reduction.
To process the data, I placed all keywords/key phrases from the job description dictionary into more broad categories to reduce feature space.
I used the min and max of every Glassdoor salary estimate to calculate a mean salary. For hourly estimates, I multiplied them by (40 hours x 50 weeks)/year to attain yearly salaries for those observations. I also separated company names from their ratings and imputed missing rating’s data with the rating’s column average. Lastly, I used Census Regions to create a region column to potentially reduce feature space in turn for State and City columns. In model preprocessing, I turned all category features into dummy variables, and I removed outliers as well as features with high correlation from the data set.
ASSUMPTIONS/BIAS IN THE DATA
The data only comes from one source—Glassdoor.com—which may be partial to specific employers and/or regions. Furthermore, not all DS employers may use Glassdoor, skewing results to a specific population that does.
RESULTS
I used Scikit-Learn machine learning library to perform all modeling
My plan of attack was to train the data with multiple models, determine the model with the best R2 (proportion of variability in our target variable that is explained by our features, higher is better) and RMSE (measure of noise in the system, lower is better) and use coefficients or some other metric to determine the features that best impact DS salary estimates. For the job location feature space, I decided to use a job listing’s state over its region or city when modeling: using the state was a happy medium between too sparse of info and too much. The first model I ran was a simple linear regression (all models were run with the same 80/20 train test split) which produced an R2 of .51 and a 50-fold cross validation (how well do model results generalize to independent data) mean RMSE of 19k. Underwhelmed with these results, I proceeded with a Lasso regression model, which punishes less impactful features to highlight the most impactful features and improve interpretability of the model. Additionally, Lasso takes in a parameter, alpha, which determines the degree to which Lasso minimizes coefficients. To find the optimal alpha I used all values .01 through 1 as alpha in a looped Lasso model to determine which alpha value produced the least error in RMSE. After determining the best alpha was .16, I plugged it into a Lasso regression along with scaled features to produce an R2 of .51 and 50-fold cross validation mean RMSE of 19k—the same as the linear regression model. I then performed a Ridge regression, which like Lasso, reduces feature coefficients, but does not zero them out completely. Ridge also takes in an alpha parameter, which I found in the same manner as Lasso. Ridge’s optimal alpha was .99, which I plugged into a Ridge regression along with scaled features to produce, wait for it, an R2 of .51 and 50-fold cross validation mean RMSE of 19k. Sadly, no model provided significant advantage.
In search of better results, I turned my sites to a Random Forest Regressor model which uses decision trees on sub samples of the dataset as well as averages to improve predictive accuracy. Even though this model is less interpretable there are ways to determine feature importance, so I proceeded with its use. After training the model, I received a significantly improved R2 of .94 and a 50-fold cross validation mean RMSE of 16.7k! I validated my results on the test data, which returned an RMSE of 16.9k, closely in step with the predicted RMSE value of 16.7k.
| R2 | µ RMSE | σ RMSE | |
|---|---|---|---|
| Linear Regression | .51 | $19k | $3k |
| Lasso Regression | .51 | $19k | $3k |
| Ridge Regression | .51 | $19k | $3k |
| Random Forest | .94 | $16.7k | $3.8k |
To put these results into perspective, on average this model can correctly predict a salary within 15% of the projected salary median of 103k. Clearly for this test case a random forest model was the best model to predict the target variable. In terms of interpretability, random forests uses permutation importance, which observes how random re-shuffling of each feature influences model performance. Permutation importance is computationally expensive, and can overestimate correlated predictors, but given the small size of my data set and the fact that I removed all corollary features, I proceeded with its use.
CONCLUSION
So, now to share what everyone has been waiting to learn: what job listing features most impact the salary of a Data Scientist in the United States? Well, after calculating the permutation importance of our random forest, the most important feature in determining DS salary is…if an employer provided the salary to Glassdoor.
A bit blasé, but Glassdoor seems to undershoot salary estimates by skewing their salary ranges to the downside, while employer provided salaries, on average trend 23k higher. Second, and a bit obvious, job postings with ‘Senior’ in the title impact the model, as does the role ‘Data Analyst,’ which trends 25k less than roles with Data Scientist in the title. The fourth, and most interesting feature to me, is a company’s age. Company age is likely an impactful feature because newer companies might be more tech focused, data growth minded, less bureaucratic, and willing to expend more capital on the right talent to improve their business. Surprisingly, things like location or specific qualifications/skills were not as high on the list, but this could be due to a more remote working environment that is less focused on offices and more focused on expanding ranges and capturing pockets of highly skilled talent nationwide.
IMPACT
For a practitioner who is financially motivated within the data science community, he/she should concentrate on attaining a role at a younger, tech and data focused company, and aspire to enter a senior non-Data Analyst role.
FUTURE WORK
To better build upon this model, I would first look to gather more data from independent sources. I think more diversity in the data set is attainable and would improve model performance. I would also look to normalize the data based on a metric like population or use GDP per capita to compare salaries across states or regions. Additional modeling to explore: XGBoost.
Check out the code for this project on GitHub!


