
EDA of MTA Turnstile Data
Metis Module 1 - Exploratory Data Analysis
ABSTRACT
The goal of this module was to use the most recent three months of MTA Turnstile data to determine the optimal geographical placement of Women Tech Women Yes’ (“WTWY”) Street Team to best collect email contacts from passersby who may be interested in their organization, its mission, and their annual gala. I grouped MTA turnstile data by total daily passages for each station. I used station location relative to the nearest universities’ STEM departments as well as specific times and days to find the most optimal locations for WTWY to gain exposure to interested populations. From the hours of 9 AM-4 PM on Tuesdays through Fridays, I recommended that WTWY station their Street Team at 14 St.-Union Sq. to gain exposure to Baruch College and heavy foot traffic. From the hours of 7-10 PM on Wednesdays through Fridays, I recommended that WTWY station their Street Team at W 4 St.-Washington Sq. to gain exposure to NYU and heavy foot traffic. And finally, from the hours of 9 AM-4 PM on Mondays, I recommended that WTWY station their Street Team at Flatbush Av.-B.C. to gain exposure to Brooklyn College.
BACKGROUND
WTWY was in search of the best NYC subway stations to place its Street Team to broaden its reach to potential individuals enthusiastic about increasing the participation of women in STEM as well as gain attendees to and support for their annual gala. I used three months of NYC MTA turnstile data to create an analysis for them.
MATERIALS AND METHODS
DATA
-
I collected three months of MTA turnstile data in CSV format from the developer open-source website: found here
-
I obtained the geographical location of MTA stations from the NYC OpenData initiative provided by the city of New York: found here
DATA CLEANING
All data was cleaned using Pandas data analysis software library
-
Several data entries for turnstile entries and exits decreased over time or had gaps of missing data; I removed these points from the data, resulting in a .9% reduction of the data set.
-
Per the MTA Turnstile field description, they maintain audits every four hours; however, the four-hour windows in the data were not the same for all turnstiles. Therefore, I bucketed time periods to provide general period overviews rather than specific times.
-
I grouped the data by turnstile unique identifiers, station location, and the line names each station houses. I utilized this method to avoid grouping together stations with the same name but separate locations and lines (i.e., the 125th street named station exists at Lexington Ave, Lenox Ave, and Manhattan Ave).
-
I combined total change in entries and exits to create a total passage count of each turnstile to create the most comprehensive picture of overall station traffic.
-
I manually altered station geographical data to correctly match the station names and line names of the MTA Turnstile data so that I could correctly output station positions on a map.
-
I used the haversine formula to calculate the distance of colleges to an MTA station. I then analyzed stations within a half a mile to a college.
ASSUMPTIONS/BIAS IN THE DATA
-
Environment: COVID 19 has drastically changed the way people commute. To gain the most current snapshot of commuter trends, I only used the most recent three months of MTA Turnstile data to conduct this analysis.
-
Data: I removed days for stations with missing or incorrect data rather than filling them. This action resulted in an additional 1.5% reduction of the data set.
EDA
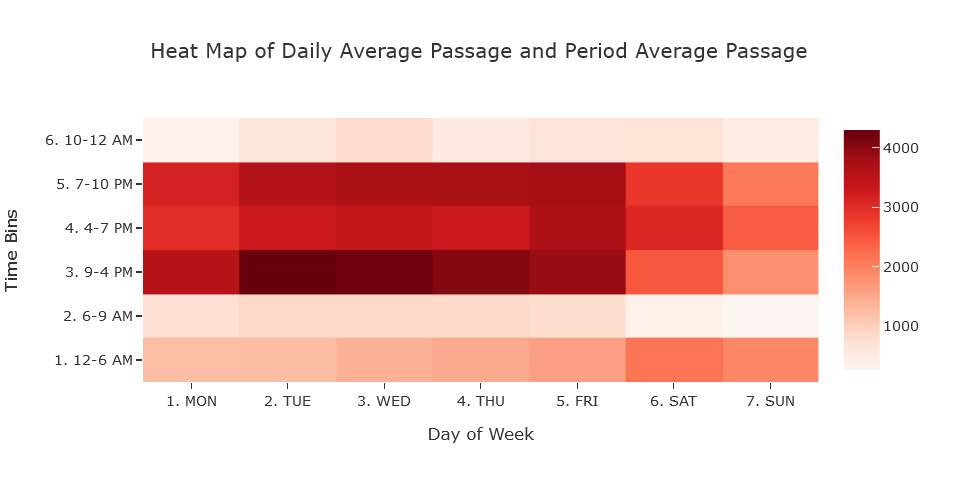
After munging the data, I recommended WTWY with specific days, times, and stations to target. My main points of focus were the distance from the nearest universities’ STEM departments, the total flow of traffic, time of day, day, and borough diversity, i.e. gain exposure to stations outside of Manhattan. On average the weekdays outpaced the weekends in total traffic, so I decided to only concentrate on weekdays. Furthermore, the busiest times of day were the 9 AM to 4 PM time bin, the 4 to 7 PM time bin, and the 7 to 10 PM time bin.
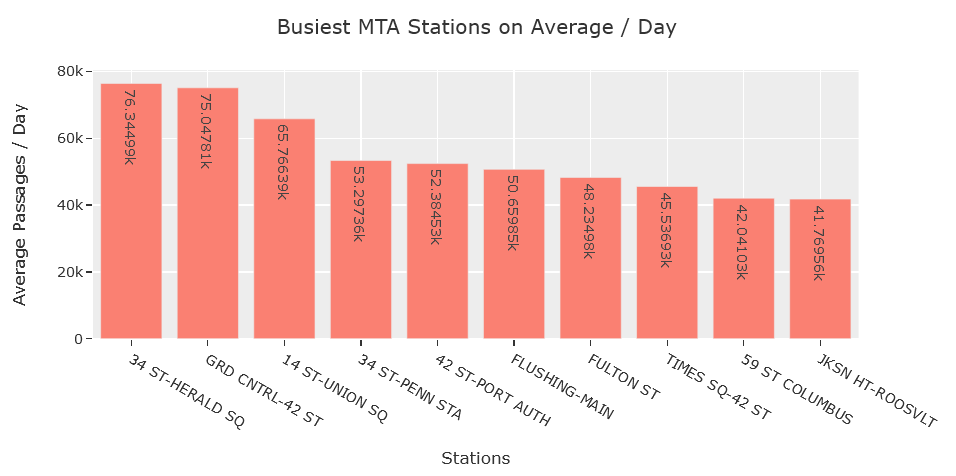
Overall, the busiest borough was Manhattan, with 34 St-Herald Sq., Grand Central-42 St. and 14 St.-Union Sq. being its busiest stations.
RECOMMENDATION
The 14 St.-Union Sq. station, within .4 miles of Baruch college, became my top recommended station for the weekdays of Tuesday-Friday from 9 AM to 4 PM. On those days and within that period, this station saw on average twenty-five thousand total passages. My second recommended station was the W 4 St.-Washington Sq. station, which is within .35 miles of NYU, for the weekdays of Wednesday-Friday from 7 to 10 PM. On those days and within that period, this station saw on average ten thousand total passages. Lastly, and in order to capture borough diversity, I recommended the Flatbush AV-B.C. station, which is .35 miles from Brooklyn College, on Mondays from 9 AM to 4 PM. On this day and within that period, this station saw on average six thousand total passages.
In table format, this is the following weekly schedule I recommended to WTWY:
| Time | Monday | Tuesday | Wednesday | Thursday | Friday |
|---|---|---|---|---|---|
| 9 AM to 4 PM | Flatbush AV-B.C. | 14 St.-Union Sq. | 14 St.-Union Sq. | 14 St.-Union Sq. | 14 St.-Union Sq. |
| 4 PM to 7 PM | - | - | break | break | break |
| 7 PM to 10 PM | - | - | W 4 St.-Washington Sq. | W 4 St.-Washington Sq. | W 4 St.-Washington Sq. |
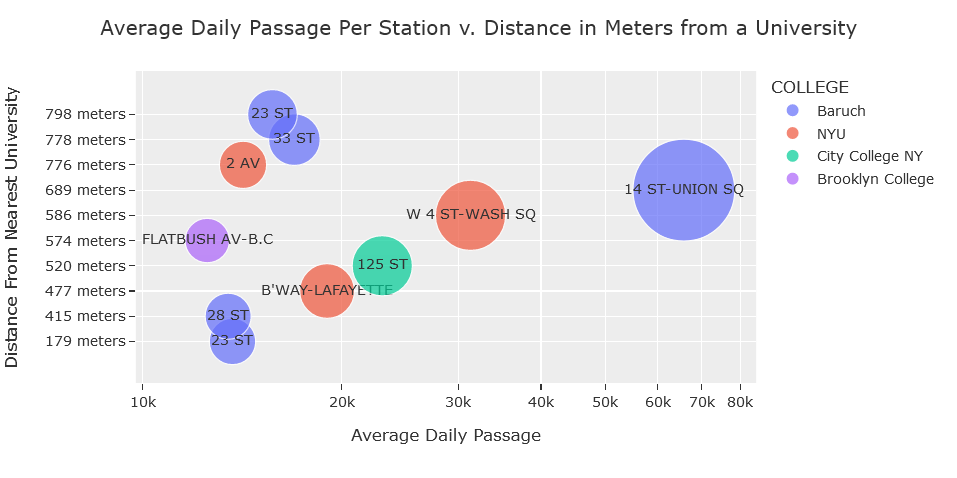
Scatter plot of the top ten busiest stations closest to a college:
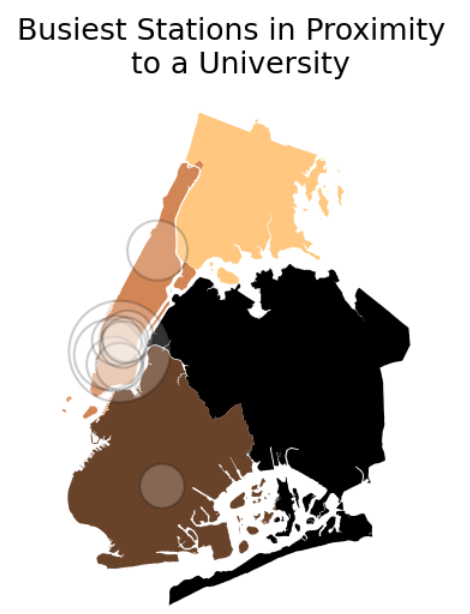
GeoPandas map of the top ten busiest stations closest to a college:
Busiest average stations and times for Baruch College:
| Station | College | Distance | Day | Time Bin | Avg Passage |
|---|---|---|---|---|---|
| 14 ST-UNION SQ | Baruch | .4 miles | Wed | 9 AM-4 PM | 26.3k |
| 14 ST-UNION SQ | Baruch | .4 miles | Tue | 9 AM-4 PM | 25.1k |
| 14 ST-UNION SQ | Baruch | .4 miles | Thu | 9 AM-4 PM | 24.6k |
| 14 ST-UNION SQ | Baruch | .4 miles | Fri | 9 AM-4 PM | 24.3k |
| 14 ST-UNION SQ | Baruch | .4 miles | Fri | 4-7 PM | 22.2k |
Busiest average stations and times for NYU:
| Station | College | Distance | Day | Time Bin | Avg Passage |
|---|---|---|---|---|---|
| W 4 ST-WASH SQ | NYU | .35 miles | Fri | 7-10 PM | 11k |
| W 4 ST-WASH SQ | NYU | .35 miles | Thu | 7-10 PM | 10k |
| W 4 ST-WASH SQ | NYU | .35 miles | Wed | 7-10 PM | 9.7k |
| W 4 ST-WASH SQ | NYU | .35 miles | Wed | 9 AM-4 PM | 9.7k |
| W 4 ST-WASH SQ | NYU | .35 miles | Thu | 9 AM-4 PM | 9.6k |
Busiest average stations and times for Brooklyn College:
| Station | College | Distance | Day | Time Bin | Avg Passage |
|---|---|---|---|---|---|
| FLATBUSH AV-B.C | Brooklyn College | .35 miles | Wed | 9 AM-4 PM | 6.5k |
| FLATBUSH AV-B.C | Brooklyn College | .35 miles | Tue | 9 AM-4 PM | 6.4k |
| FLATBUSH AV-B.C | Brooklyn College | .35 miles | Fri | 9 AM-4 PM | 6k |
| FLATBUSH AV-B.C | Brooklyn College | .35 miles | Thu | 9 AM-4 PM | 5.9k |
| FLATBUSH AV-B.C | Brooklyn College | .35 miles | Mon | 9 AM-4 PM | 5.7k |
FUTURE WORK
For future work and with respect to commuter changes in travel due to COVID-19, I would like to analyze current trends in ridership of busses versus subway trains. Double exposure to trains and subway stations could be advantageous for Street Teams if they station within a short distance of a bus stop and subway entrance. Additionally, I would want feedback from WTWY based on the above recommendations and provide supplementary days, times and locations if desired by them.
Check out the code for this project on GitHub!