
Stock Fundamental Research Pipeline
Metis Module 3 - Introduction to Data Engineering
ABSTRACT
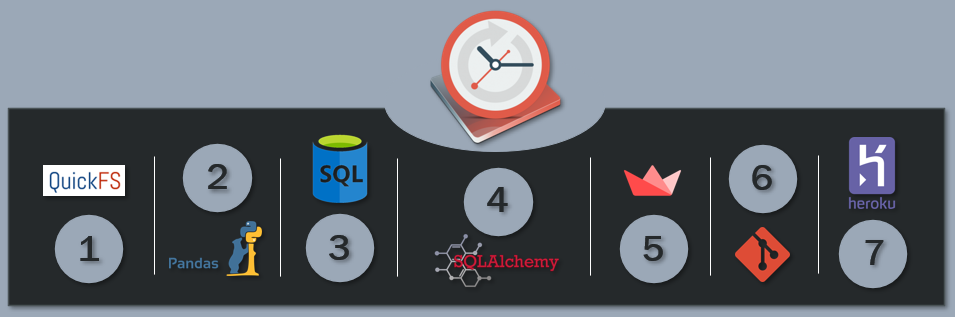
I built a pipeline to pull data from QuickFS.net’s API, which is a service that provides its users financial data from publicly traded companies’ quarterly filings with the SEC. I cleaned the pulled data with Pandas’ software and saved the results using SQLite to SQL databases. I then used the databases along with Streamlit to build a web application that performs fundamental analysis on over two thousand stocks with over five million data entry points. This analysis provides users with a proprietary score, in addition to other visual metrics, to identify securities displaying powerful fundamental characteristics. I then pushed the databases along with the web app to Heroku, a cloud application hosting service, where my site is publicly available across the world wide web.
Click here: POWERFUL Stock Fundamentals Research Tool
BACKGROUND
I have long held a fascination with the financial markets, especially the use of fundamental data since my collegiate years. After a career as a market maker at the CBOE, I maintained my interest in Wall Street and found great resource in a storied stock trader by the name of Mark Minervini. I used his research and fundamental analysis along with a myriad of other resources to build a general but powerful fundamental overview for securities that users, in tandem with other research and analysis, can use to make educated stock purchases. My work for this module is the culmination of all my previous studies and research expressed programmatically to establish an automated pipeline to streamline and provide end users with a practical and useful fundamental analysis tool.
MATERIALS AND METHODS
Note: the following pipeline was automated using Cron.
DATA
I pulled all data from an API using the Python requests library and json
The data for this pipeline comes from the QuickFS.net API which is a service that provides fundamental data gathered from financial statements hosted on the US Securities and Exchange (SEC) Commission’s EDGAR website. QuickFS.net provides clean, accurate and robust data for its users who can then analyze securities in a manner tailored to their needs.
DATA CLEANING AND STORAGE
I cleaned all data using Pandas data analysis software library and stored all data to a SQL database using Pandas .to_sql
I used a pre-defined list of stocks and a for loop to gather data for each security one by one. I pulled each security’s max available fundamental data from the API, then I used Pandas and a suite of functions that I created to transform the data and store it into a data frame. I then used Pandas’ function .to_sql to insert the data frame into two predefined SQL databases for storage.
The for loop generated and stored a total of ~5.1 million data points (each databases’ shape was ‘111092 x 45’ and ‘1939 x 45’ respectively).
WEB APP AND DEPLOYMENT
I used Streamlit, Plotly, and Yahoo Finance to construct a web app and Heroku to host the app
To build the web app I used Streamlit, which “is an open-source python framework for building web apps for machine learning and data science.” The ease, familiarity, and quickness of Streamlit made it desirable to use for this module. To construct graphs within the app I used Plotly, an interactive graphing library, and I used Yahoo Finance’s API to pull in historical price data to construct charts for each respective security. Lastly, I used Git to push my databases and apps to Heroku, a cloud application hosting service, to make the app publicly available on the world wide web.
ASSUMPTIONS/BIAS IN THE DATA
The data consists of two thousand of the largest capitalized stocks, therefore missing over 5,500 publicly traded companies, including most mid and all small cap securities. Additionally, the transformation of the data provides a general surface level fundamental analysis of a company’s health and misses a deeper more tailored analysis based on overall market conditions, industry, and other fundamental metrics.
RESULTS
RESEARCH PAGE
The app’s Research page provides year over year quarterly analysis of a company’s earnings per share (EPS), sales, and profit margin. This means that the app compares the same quarter in the previous year with the same quarter in the current year to account for seasonality performance within a company’s business cycle—comparing apples with apples. Why does the app use EPS, sales, and profit margin? All three metrics provide a great basic understanding of a company’s overall health. EPS is a company’s total sales divided by the total amount of outstanding shares to measure a company’s profitability. Sales show the total amount of money a company was able to generate from its goods and services. And profit margin is a company’s total sales less the cost of doing business, hence profit. Analysts use either GAAP or non-GAAP accounting principles to calculate EPS and profit margin. GAAP or “generally accepted accounting principles,” refers to a common set of accounting principles to determine a company’s overall health, however GAAP can display high earnings volatility. Therefore, analysts apply non-GAAP accounting principles to paint a less volatile picture of a company’s performance. This app provides analysis of both figures.
The app uses the aforementioned financial metrics to generate a comparison analysis between consecutive quarters to see if a security is making consistent and consecutive gains. Consistent gains on either a single quarter or two-quarter rolling basis in all three areas can show that a company is firing on all cylinders. The app defines increased EPS, sales, and overall profit margin for three or more quarters as a ‘tenet’ and displays it with a ‘T.’ Additionally, the app provides non-GAAP and GAAP quarterly EPS percent changes, as well as revenue, for each quarter on a single quarter and two-quarter rolling basis. Lastly, the app makes an annual comparison between the current year relative to the previous three years. If a security is outperforming the previous three years in non-GAAP/GAAP EPS or Sales by 75 percent or more (calculated using the current trailing twelve-month (‘TTM’) period), the app returns ‘BO’ which identifies a breakout phenomenon. Finally, the app provides a proprietary ‘Total’ score that weighs all columns and is representative of a company’s overall health. The app uses this figure as a quick snapshot to quickly compare companies fundamentally and determine if the user should perform further research for a particular security. The app defines all table symbols as follows:
Symbol legend:
‘ - ‘ = less than 0% ( < 0 )

‘ . ‘ = between 0 and 18% ( 0 <= 17.5 )

‘ ~ ‘ =  between 18 and 40% ( 18 <= 40 )

‘ ^ ‘ =  between 40 and 100% ( 40 <= 100 )

‘ ! ‘ = greater than 100% ( 100 < )

‘ T ‘ = Tenet met

‘ M ‘ = Quarter momentum met for a particular metric

‘ D ‘ = Quarter deceleration in momentum met for a particular metric

‘ BO ‘ = Breakout met
The app also provides charts that display non-GAAP/GAAP EPS and Sales on a non-rolling and rolling basis to visually display a company’s performance over time. Additionally, the app provides a nine-month Yahoo Finance and Plotly candlestick chart to the user for price analysis. The user can also go back in time and generate research for previous earning reports and also receive a three-month price change post the release of each report as well as its accompanying chart to visually display that report’s reception through its price performance. Users can also use Plotly to alter each chart as well as download the chart if desired.
Notably, the app uses warning and exception handling. Any stock tickers incorrectly entered will return nothing. Any delisted stocks or stocks that are missing price data will display an error message. Lastly, research of reports older than 90 days will display that the user is not viewing the most recent quarter’s report, which accounts for research awareness and the possibility that the app is missing the most current data for that security.
LEADERBOARD PAGE
The app’s Leaderboard page displays the top 250 securities ranked by their proprietary ‘Total’ score. Users can quickly come to this page in order to get a sense of which companies are displaying the highest degree of powerful fundamental health for the current quarter. Furthermore, users can start their research on the Leaderboard page and then go to the Research page for a deeper analysis of a particular security.
DEMO
Demo of POWERFUL Stock Fundamentals
CONCLUSION
IMPACT
This web app is a powerful but simple tool that allows users to get a quick fundamental snapshot of unique metrics to measure a company’s overall general financial health to assist in and make educated investment decisions. The app not only gives users the current state of the company’s financials, but the app gives users the most recent comparisons as well as the ability to retrieve and analyze historical earnings reports. Additionally, the app uses price data to chart a stock’s current performance as well as historical performance after the release of each report to gauge impact and reception by investors at that time, i.e., did investors buy or sell the stock after the release of this report?
FUTURE WORK
I want to develop an even more detailed and specialized fundamental analysis for each security that is industry specific and includes a more granular investigation into each earnings report. Lastly, I would like to incorporate additional data, such as niche metrics provided by services like Investor’s Business Daily, to provide even more detail within the Research page.
Check out the code for this project on GitHub!